RAPPORTS ET ANALYSES

Pour analyser, visualiser et partager
vos insights
où et quand vous le souhaitez


Téléchargez facilement les données

Upload, access and sync your data files with a fast and
easy-to-use platform that works across all data formats.

Demander une démo

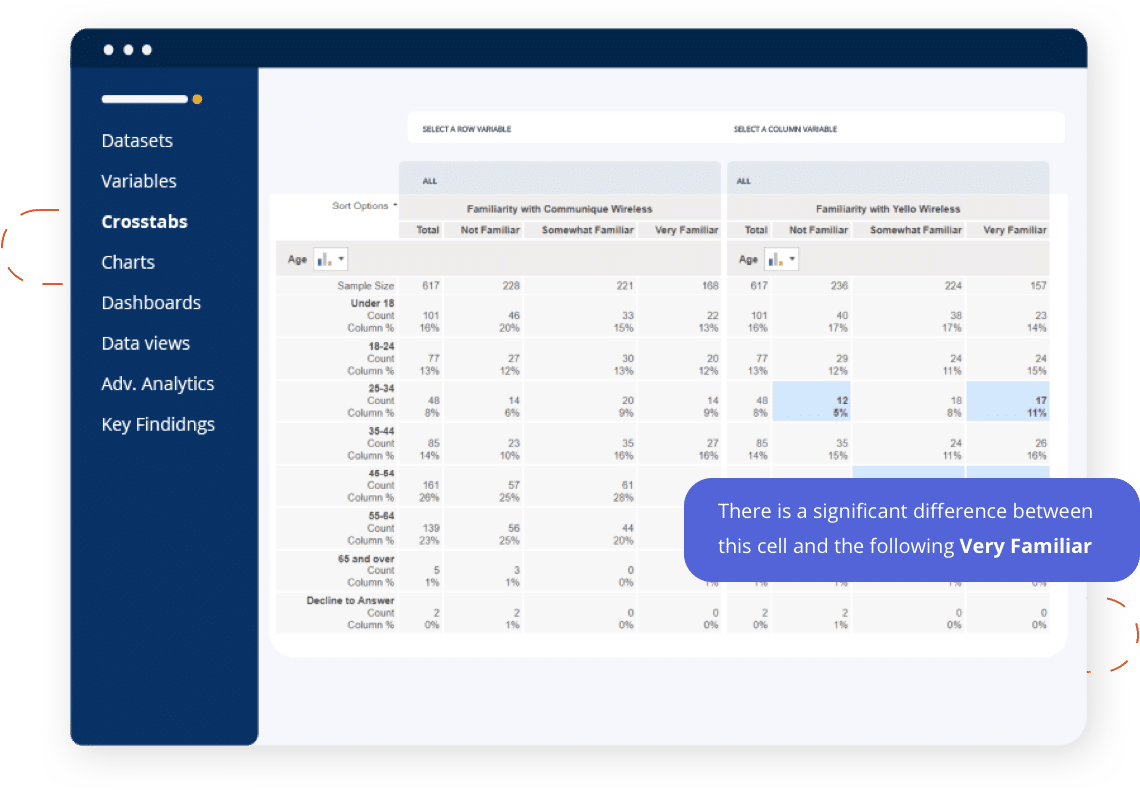
Créez des tableaux croisés robustes

Uncover significant findings in seconds, while maintaining the highest quality data, using AI and feature-rich crosstabs.

Demander une démo

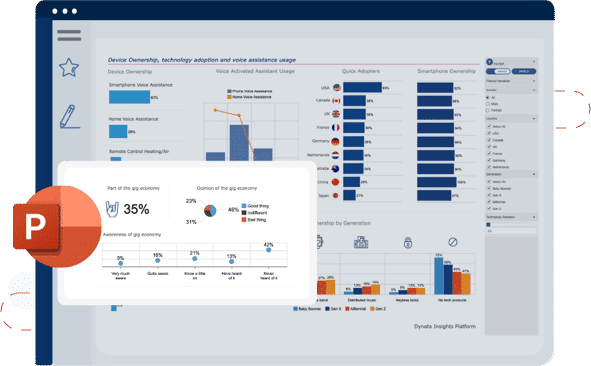
Présentez les données de façon créative dans des diagrammes et des PowerPoints

Instantly visualize findings and, with the click of a button, export them to native PowerPoint templates that will update with your latest data. Tight deadline? Automate reporting for faster delivery.

Demander une démo

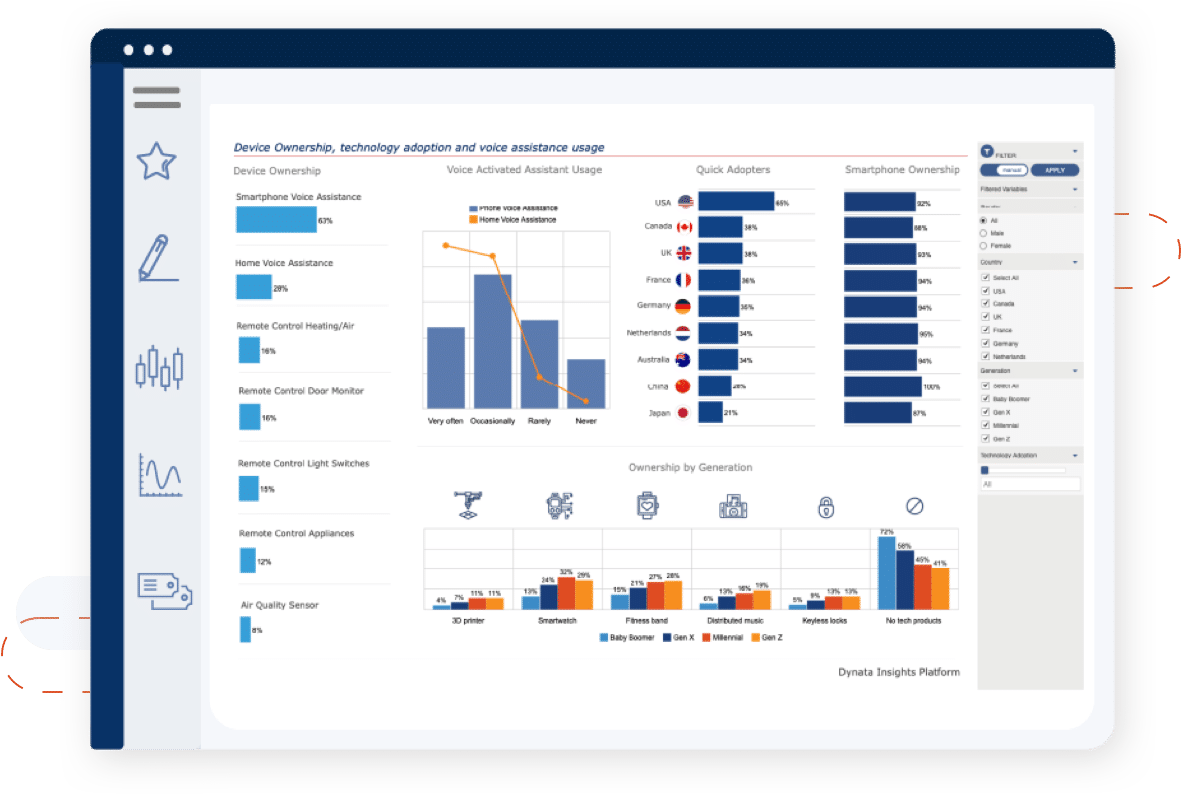
Racontez une histoire avec vos données

Illustrate insights by creating interactive visual dashboards with filter-driven custom views that update with each new wave of data.

Demander une démo

Fournissez des insights aux décisionnaires

Maximize actionable results by sharing your insights using
cloud-based collaboration, free and secure via branded
PowerPoint, a secure online portal or interactive dashboards.

Demander une démo

Modèles de services et d’assistance flexibles

Depuis nos 44 bureaux à travers le monde, 3 000 experts Dynata sont à vos côtés pour transformer vos données en insights

DO IT YOURSELF

DO IT TOGETHER

DO IT FOR ME

DEMANDER UNE DÉMO