
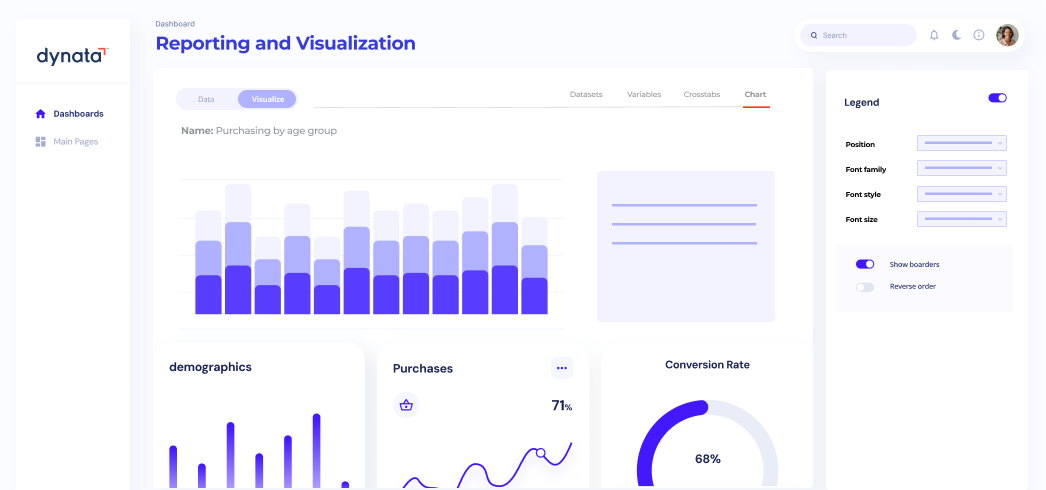
From raw data to actionable survey analysis
Survey data is only valuable if you can extract meaningful insights and share them effectively, but complex
analysis and reporting often require specialized tools or expertise. Dynata’s DIY survey data visualization platform
simplifies this process, helping you build dynamic survey results dashboards and run in-platform analytics with ease.
Whether you’re sharing crosstabs, exporting visuals, or spotting trends, our survey data analysis tool empowers any
team to explore, visualize, and present insights faster.
- Instantly visualize insights with interactive, customizable dashboards.
- Save hours with automated stat testing and direct PowerPoint exports.
- Easily integrate and manage data from popular survey platforms.
Turn your research into compelling, self-updating dashboards—no hassle, just insight.
See how seamlessly you can integrate your data and start telling a clearer story.

Rich feature set empowers your survey data analysis

Drag-and-drop dashboards
Build professional dashboards quickly with simple drag-and-drop tools.

Interactive charts
Create visualizations that update automatically as new datasets are added.

Direct dataset editing
Clean and manage data directly within the platform without external tools.
Easy data uploads
Seamlessly integrate with top survey platforms for fast data ingestion.

Automated stat testing
Identify significant findings automatically without manual calculations.

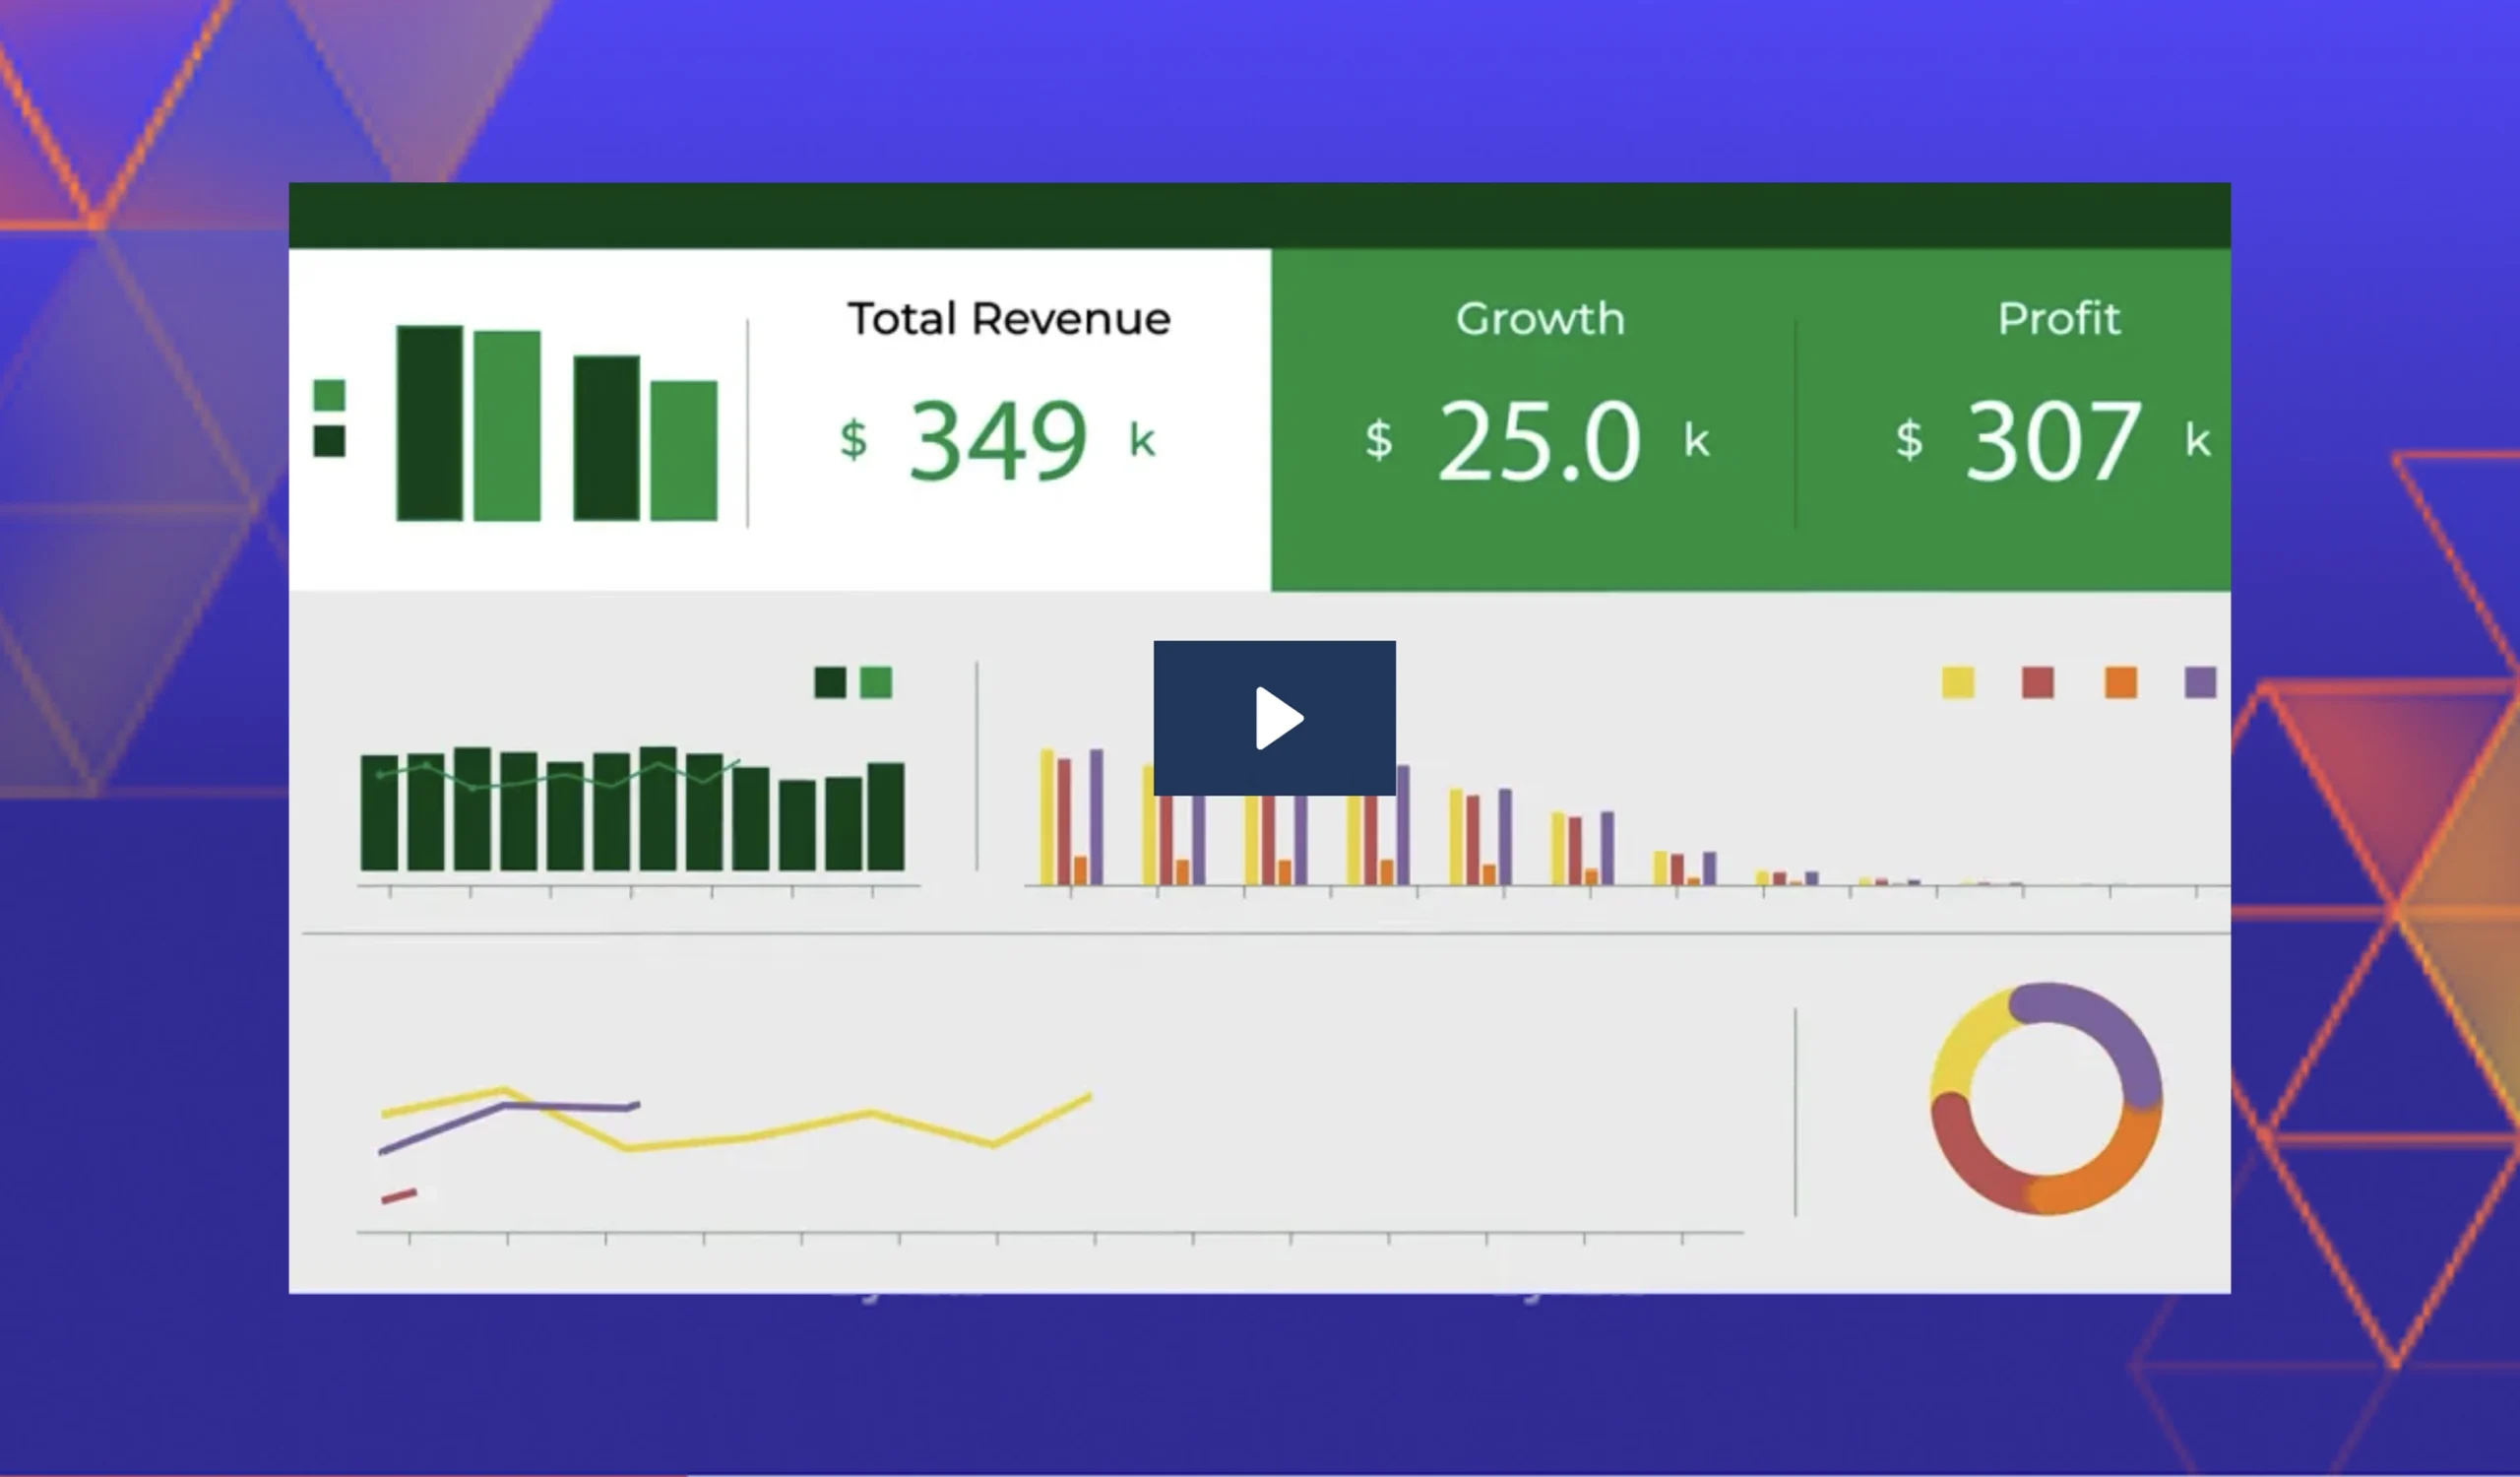
Export to PowerPoint
Save time by exporting charts and dashboards directly to editable PowerPoint files.

Secure sharing
Share insights securely with internal and external stakeholders via customizable folders.

Rich crosstabs
Conduct deep analysis with easy point-and-click controls for filters, variables, and comparisons.
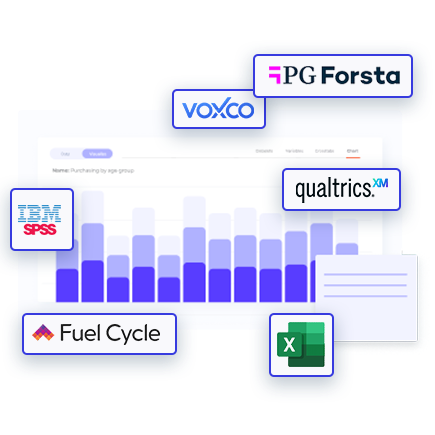
Seamless integration with your data ecosystem
Dynata’s platform integrates effortlessly with leading survey platforms and data formats, enabling fast uploads and real-time data access. Leverage robust APIs for embedding content and maintaining brand consistency across all visualizations
and reports.
“The key benefits of working with Dynata is the global reach, the single source of panel for consistency and comparability across countries…Their focus on prevention of fraud is in their DNA, which is critical for the success and reliability of the results.”
Explore Related Content

Panel book
Learn more about the Dynata panel, our global reach, and respondent profiling
Reach the right people, anywhere, anytime…

Sampling done right: Best practices for reliability, repeatability, and projectability
Discover the hidden factors that make for a strong sampling protocol Whether surveying panel respondents across several continents or microtargeting…
Dynata Data Reporting & Visualization – DIY
You’re a market research superstar that wows stakeholders with your brilliant insights. But sometimes, those insights end up looking, well, not so brilliant.
Connect with the team
We’re here to help with a project, provide more information, or answer
any questions you may have.