
Tools designed to extract value from your surveys
Dynata survey tools go beyond data collection – we help you see the full picture.
With advanced data visualization, qualitative and quantitative methods, and powerful AI analysis. Whether you’re uncovering motivations, tracking sentiment, or segmenting audiences, Dynata delivers flexible, scalable tools that combine human insights with machine intelligence.
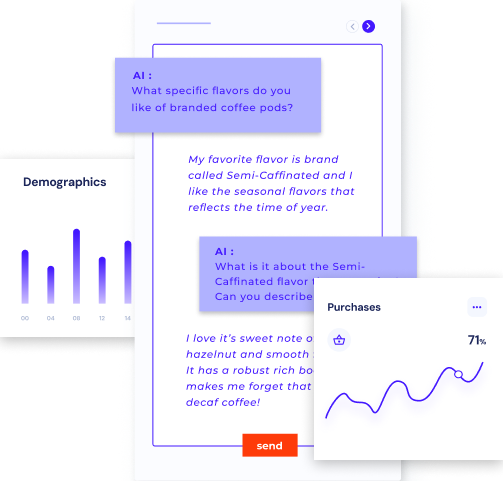
Quali-Quant AI
Couple qualitative data with deep quantitative feedback at scale.
We leverage conversational AI to simulate a one-on-one chat to delve deeper into respondent feedback.
- Engage more deeply and more naturally
- Share more thoughtful, considered feedback
- Reveal the “why” behind their behavior and attitude
Data Visualization
Stay focused on project work by outsourcing your data visualization needs to Dynata.
Let us turn your insights into brilliant, executive-ready dashboards and interactive reports.
Dynata offers custom data reporting and visualization solutions that range from basic scorecards
to fully customized, executive-ready, interactive dashboards.
These highly visual dashboards facilitate easy-to-digest KPI reporting and analysis,
while Dynata’s data experts ensure you get the precise output you need.
- Tell a compelling story with turnkey custom visuals that amplify insights.
- From scorecards to interactive dashboards — all fully customized.
- Spot trends quickly and see KPIs and analyses clearly, even mid-project.
Learn more about Data Visualization
Connect with the team
We’re here to help with a project, provide more information, or answer any questions you may have.