
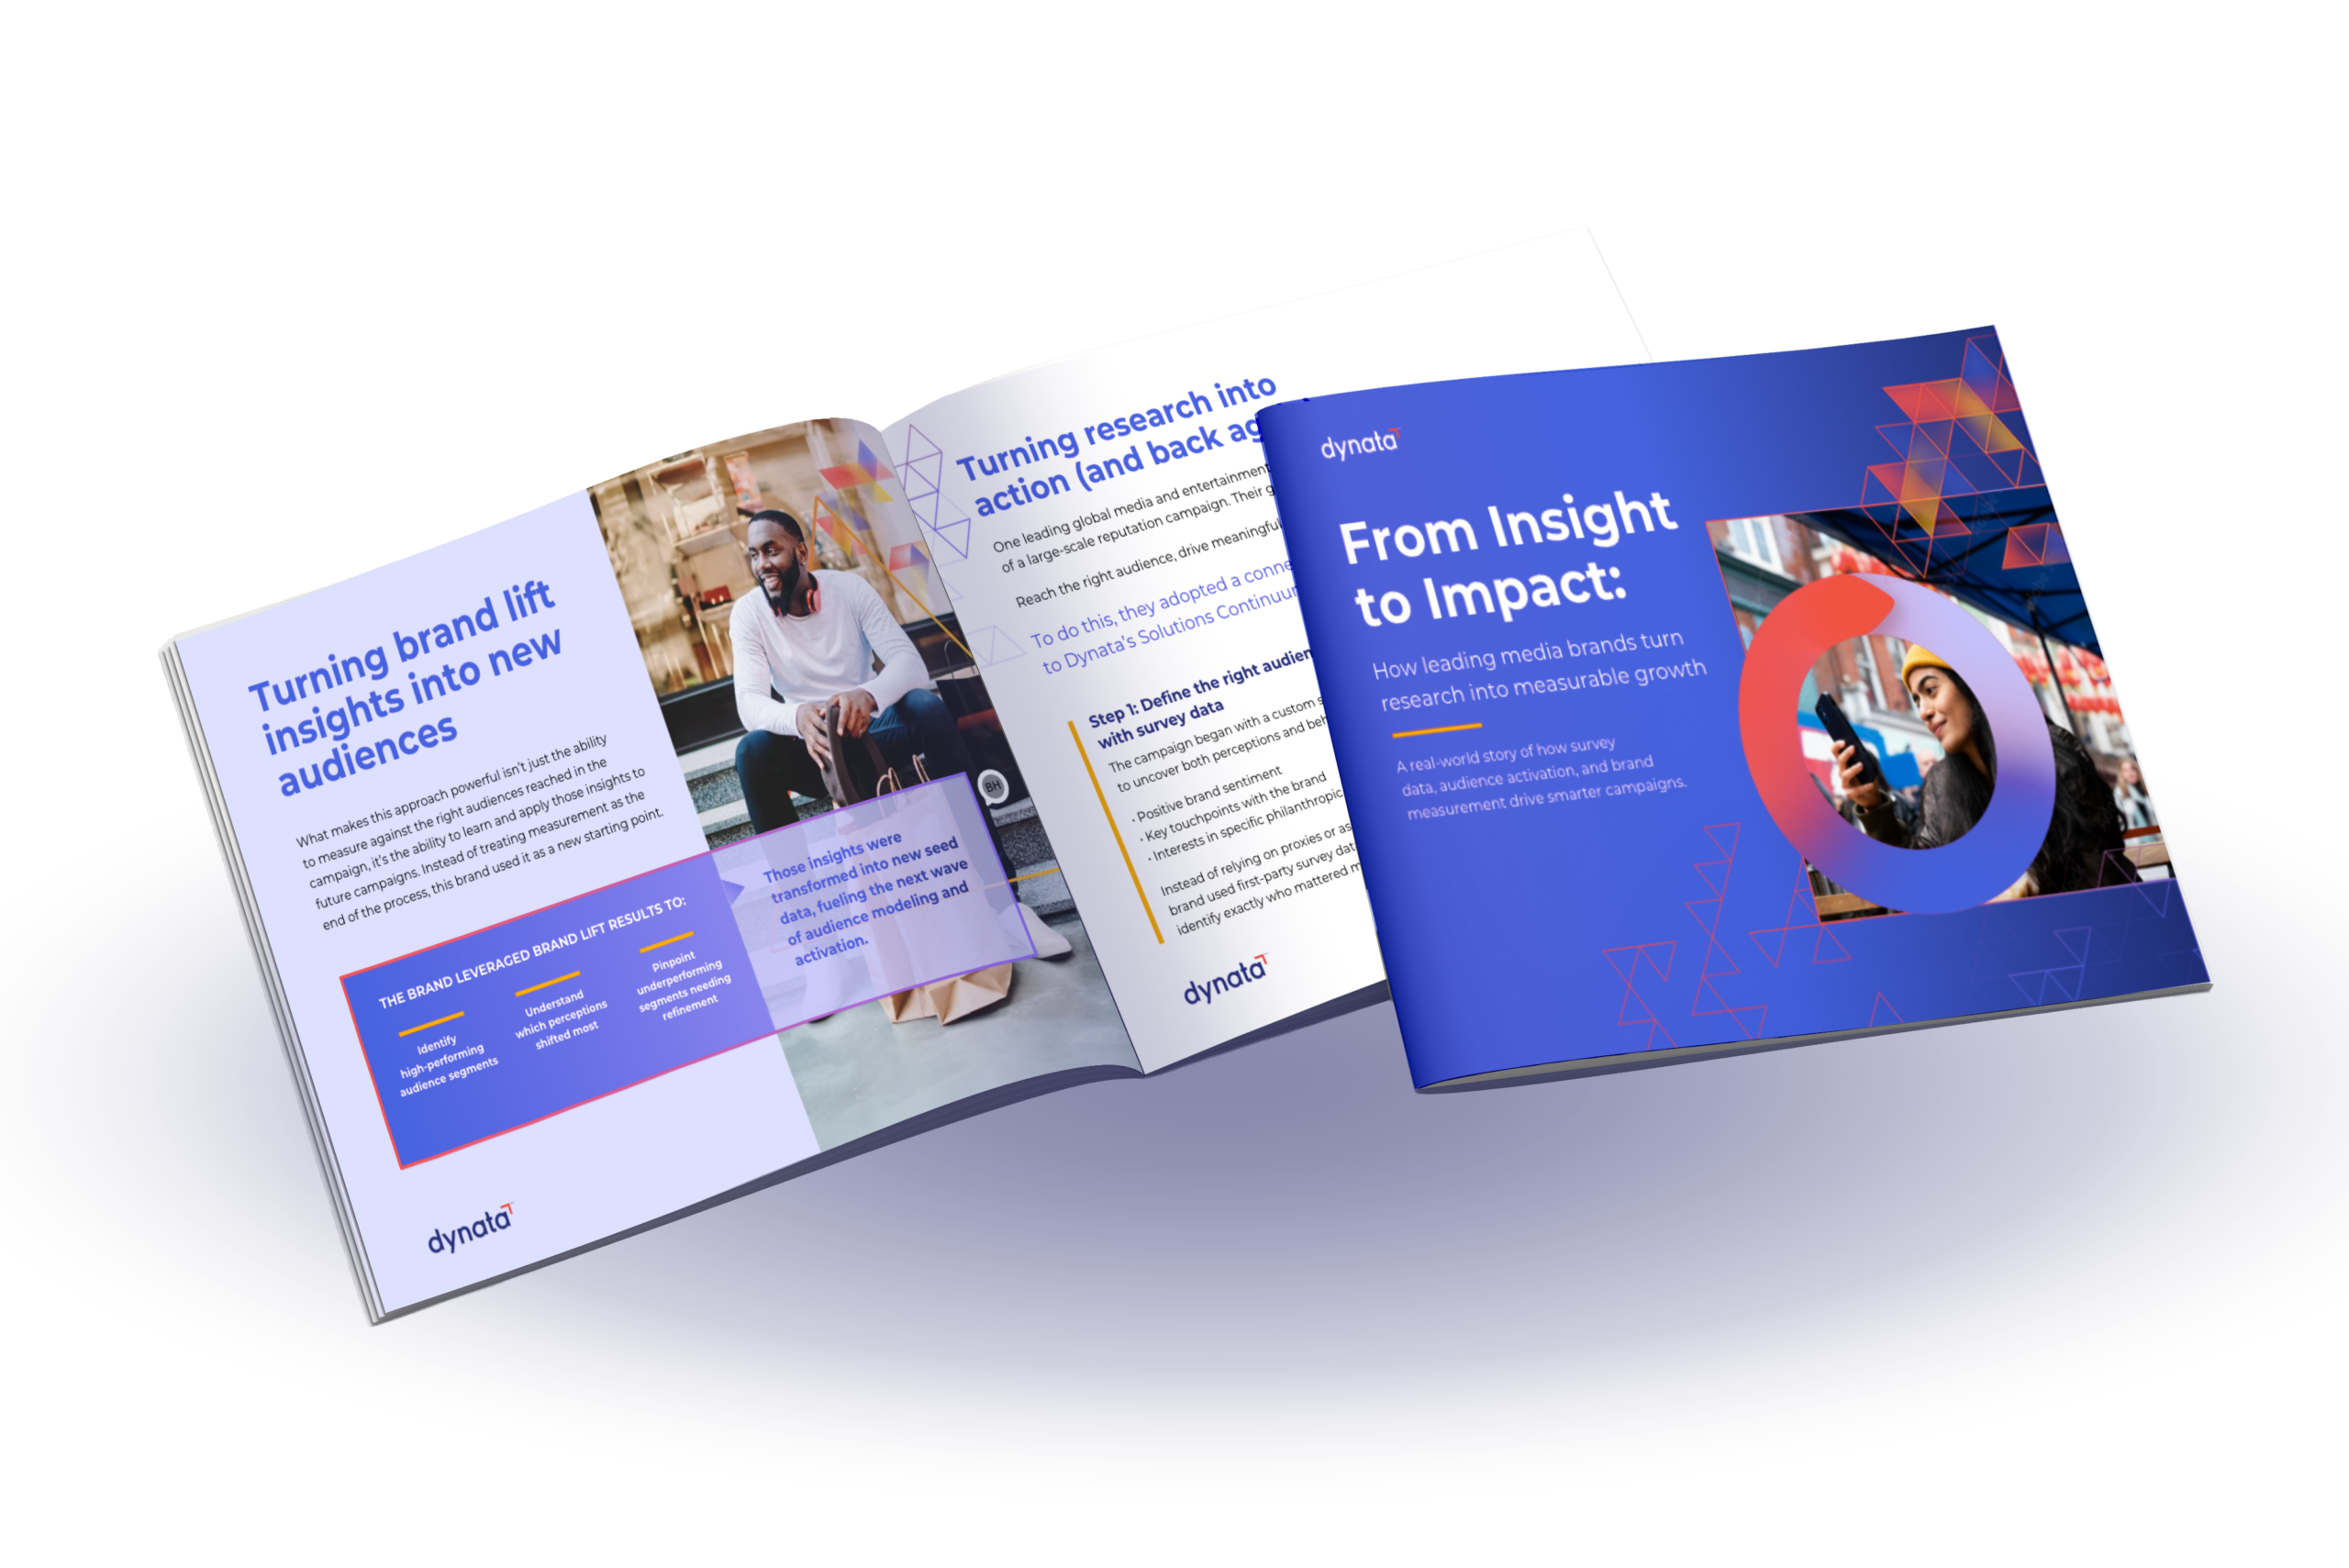
eBook: Turning insights into impact: How leading media brands turn research into measurable growth
In this eBook, you’ll learn how global media brands transform survey research into a tangible data asset for audience targeting…
Download now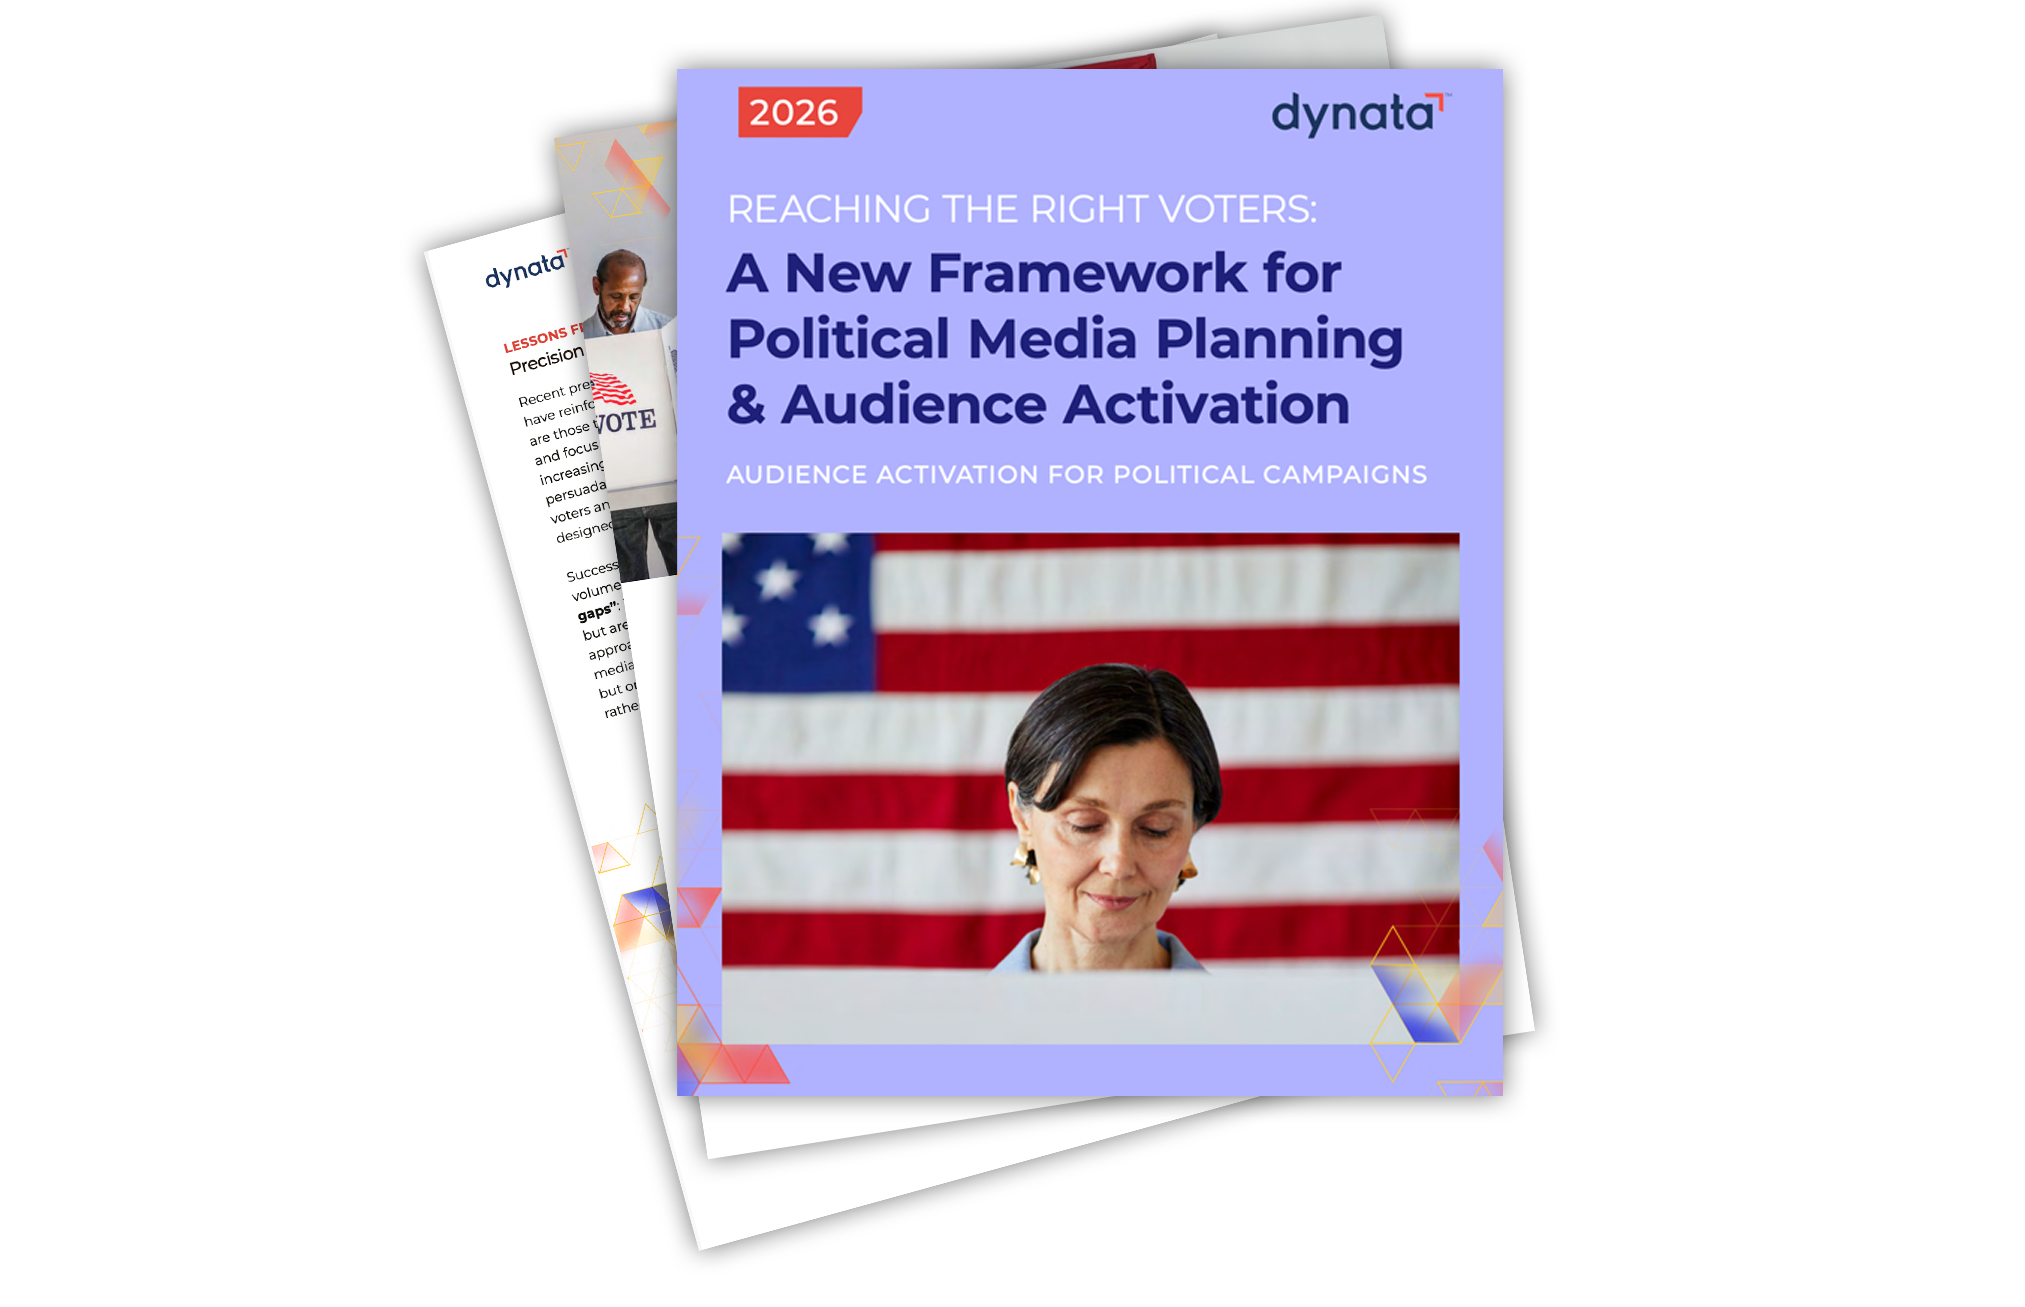
Reaching the Right Voters: A New Framework for Political Media Planning & Audience Activation
This eGuide is designed for political advertising media planners, buyers, and strategists who need to:
Download now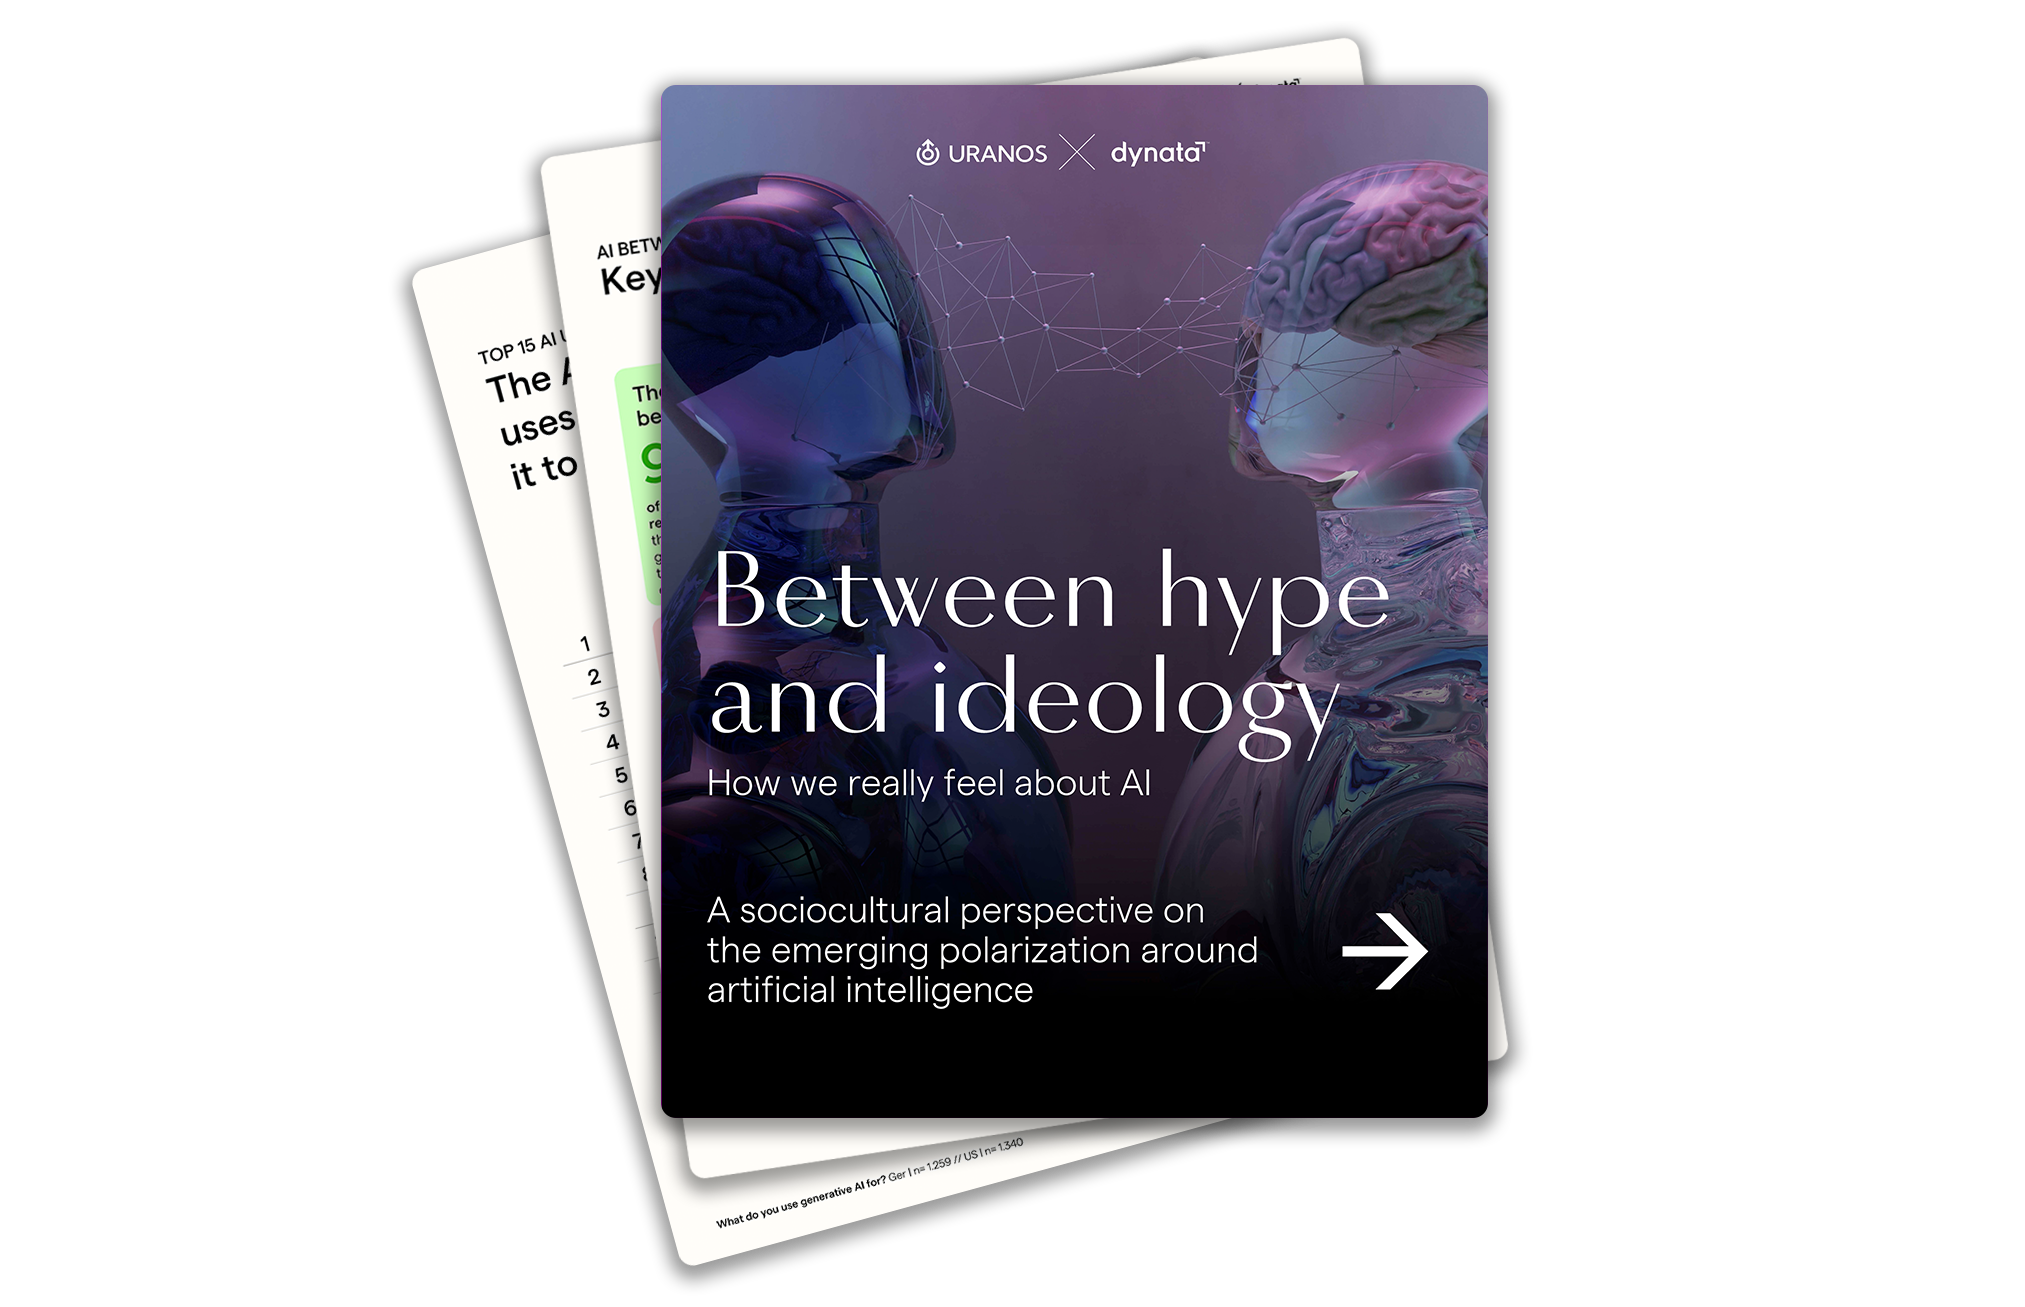
AI Attitudes: Between Hype and Ideology – a Uranos | Dynata study
How we really feel about AI a sociocultural perspective on the emerging polarization around artificial intelligence. During the survey period…
Download now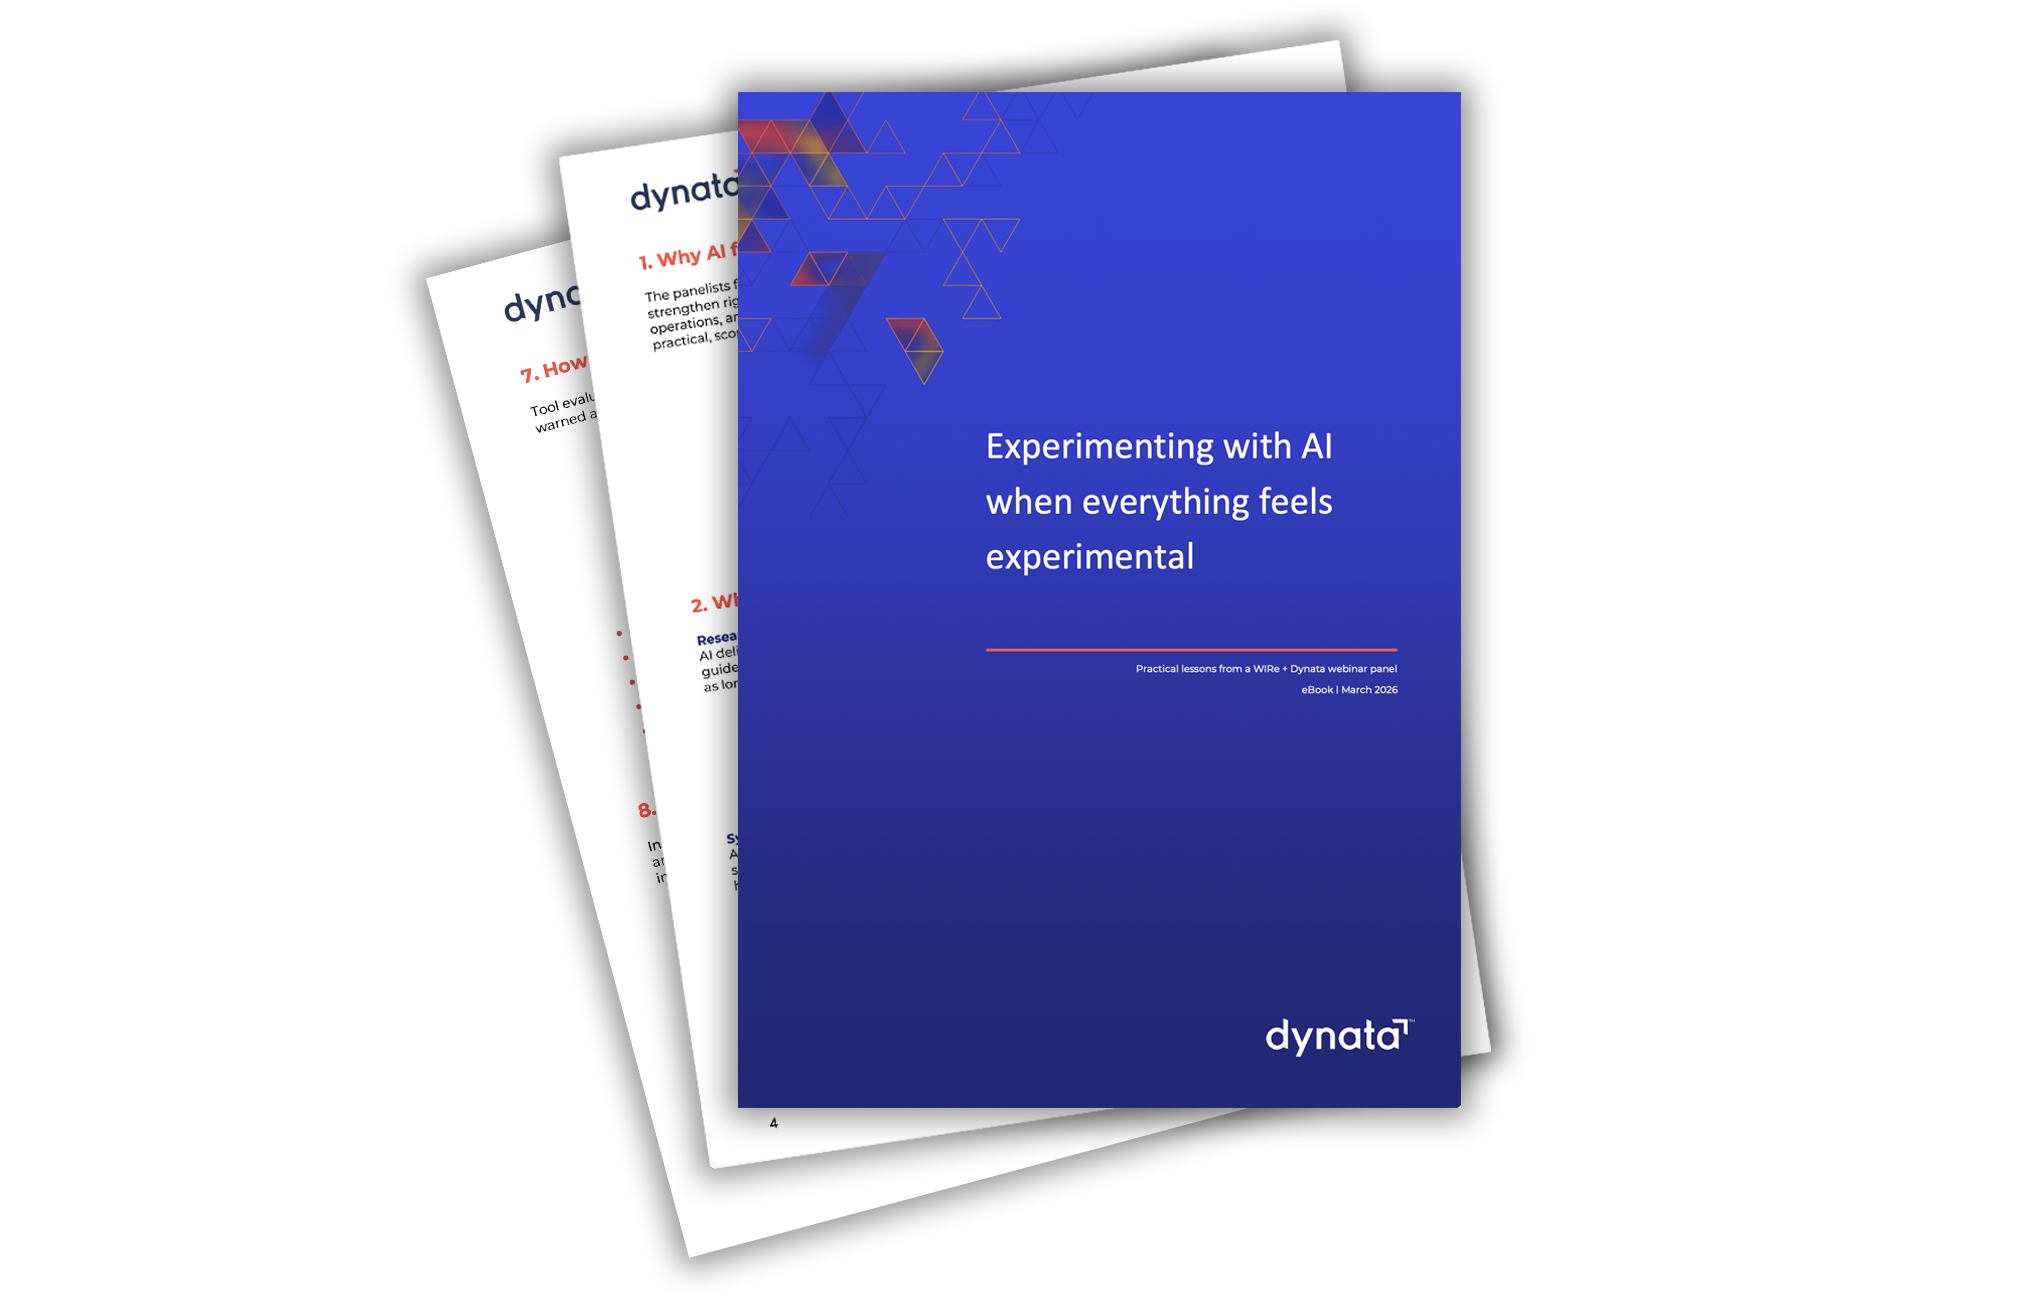
Experimenting with AI when everything feels experimental
Executive summary AI is already embedded in research workflows, whether teams call it AI or not, yet the speakers emphasized…
Download now
Dynata’s responses to ESOMAR’s 20 questions for AI-based research services
At Dynata, AI/ML is integrated into multiple aspects of our business – from our fraud detection approach, participant quality scoring,…
Download now
Harness consumer intent for smarter audience segments
Our latest Audience Trends Guide reveals how consumer resolutions translate into real purchase behaviors and how you can activate high-propensity…
Download now